
How to Describe a Pie Chart
In the IELTS Academic writing test, you are often asked in Task 1 to describe a chart, table, graph or diagram in 150 words (minimum) approximately. You are normally required to 'report the relevant information and make comparisons where relevant'.
Here are three example IELTS Academic Writing Task 1 answers showing different ways to approach the task.
Created by The Concord Coalition
How to Describing a Pie Chart 3 Sample Answers
Sample Answer 1 General
The pie charts show the two main components which make up the US federal budget in the 2012 fiscal year, namely, annual federal expenditure and annual federal income.
The first pie chart illustrates the four main areas of federal spending: health, social security, defense, and income security. The combined expenditure of these four sectors alone accounts for over 75% of annual federal spending.
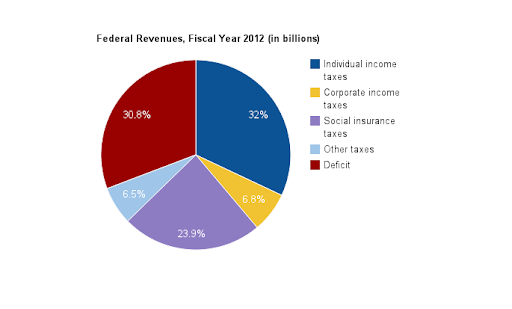
The second pie chart shows the different sources of federal income. The main sources are: personal income tax and social insurance taxes. The chart also clearly shows a deficit which is more or less the same in value as each of the two principal sources of income.
It can clearly be seen that government spending is greater than the income it receives. It can also be seen that the cost of interest payments to service the deficit debt is greater than combined annual federal spending in the areas of education, the environment and international affairs.
Sample Answer 2 Percentages
As can be seen from the two pie charts, the annual US federal budget consists of two main elements: expenditure and income. The charts show the breakdown of income and expenditure in the fiscal year 2012.
There are four principal areas which represent the majority of expenditure. The largest expense is that of health at 23.7%, followed by social security at 21.8%, defense at 19.2% and income security at 15.3%. Various other areas combined represent just under 20% of further expenditure.
In terms of income received by the government, there were two principal sources; these were income taxes on individuals and taxes related to social insurance. An additional 13% was received from corporate and other taxes. The second chart also illustrates the amount of the deficit (30.8%) in 2012, showing that overall expenditure far exceeded the income received.
Overall expenditure in 2012 was much greater than the income the government received. We can also see the cost of this deficit in terms of the interest (6.3%) the government had to pay to service the deficit debt. This sum exceeded the total amount spent on education in the same fiscal year.
Sample Answer 3 Numerical
The two pie charts contain information about income and expenses related to the US federal budget in the fiscal year 2012. The US budget had an overall deficit of $1089 in this period.
The first chart shows the amount of money spent on each area, the four main ones being: health $838 billion, social security $773 billion, defense $680 billion and income security $542 billion. There was additional spending, but at much lower levels, on various other areas such as education, interest payments and international affairs among others.
In the second chart, the amount received and sources of income are shown. The largest source was personal income taxes contributing $1132 billion followed by $845 from social insurance taxes. It can also be seen quite clearly that the deficit of $1089 billion was more or less equal to the total amount of revenue received from personal income taxes during the period.
The cost of the deficit ($222 billion) can be seen in the first chart as the interest which is paid to fund the spending not covered by income received in the fiscal period covered.
How would you answer this IELTS writing practice Task 1 question?